


How To Build A Dashboard
Restrict views to a subset of your monitored elements in Groundwork Monitor Professional.
Showing only a portion of your monitored infrastructure for designated viewers has applications in the MSP market and in enterprises where responsibilities are divided for security reasons. Groundwork Monitor Professional has capability for this type of restriction, utilizing the Dashboard Builder application. The Dashboard Builder includes options upon saving the finished dashboard for setting permissions by user, group, or role, as defined in the Administration section of the portal.
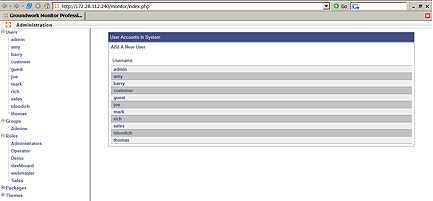
These classifications can be applied to an individual dashboard as well as to the portal itself. For this function, it is useful to have defined a role that has access only to the Dashboard Reader application as shown here.
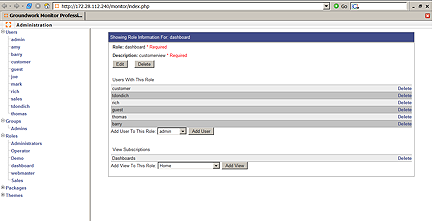
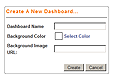
Once the Role is defined, then the individual users can be assigned their respective dashboards inside the Dashboard Builder. Access the Dashboard Builder from the pull down menu and select NEW. An option dialog box will appear with a NAME form, and the option to choose either a color or an image (e.g. .gif or .jpeg file) for the background.
Once the dashboard has been named and a background selected, the builder application will open. The screen will show two boxes, one with a list of "widgets" which are PHP based interactive objects that can be configured to represent host groups, hosts, performance graphs, and services. The other box allows resetting of the background and permissions.
The "troubled host list" and "troubled service list" widgets are automatically populated with hosts and services that have alarms, and as such are not applicable to a restricted view. The "Console" and the "Tactical Overview" are also general in nature and do not allow restricted views.
To activate a widget, left click on it and drag it into the dashboard area. To configure the widget to display the selected objects, right click on it.
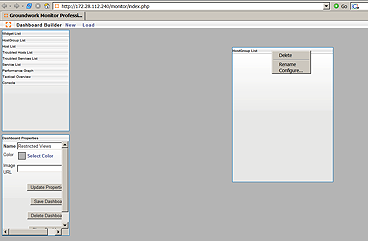
For the host group widget, type in the name of the host group(s) you would like represented, and click on Add Hostgroup. Then click OK.
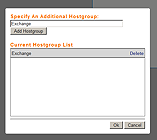
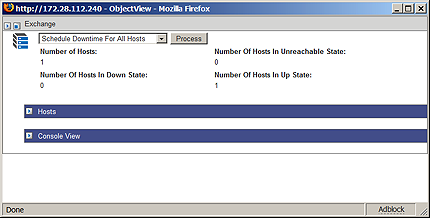
This will yield the interactive object that when selected, will open up a window in Status Viewer with access only to that host group.
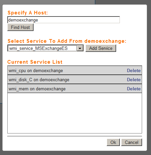
The Host widget operates the same way as the Host Group widget. The Services widget, asks for the hostname first, then provides a pull down where you can select the services you'd like to display.
In practical application, the Host Group widget already gives drill down access in Status Viewer for the hosts and services in the selected host group. In modern application delivery, there may be services running on separate hosts that support that application. For example, a database on one machine, some web services on another machine etc. In this case it can be valuable to select those services ad hoc in order to give visibility to all the components necessary for successful application delivery.
Nagios®* has the organizational ability to allow hosts to occupy more than one host group. These can represent sites, device types, or application infrastructure. For example, everything that is needed to assure Email could be grouped into one host group, including the network switch connecting the servers.
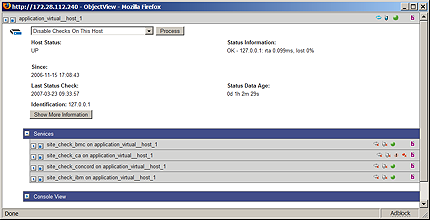
Nagios also allows the creation of "virtual" hosts, i.e. a host with no physical machine associated with it. With this virtual host, you can assign services that are running on distributed machines that comprise an application delivery. The appropriate services could then be accessed via a Host widget representing the virtual host, with drill down capability in Status Viewer for those distributed services.
The performance graph widget is configured the same way as the service widget, choose a host, and choose the graphs desired from the list.
When the dashboard contains the desired Host Group(s), host(s) and services, click on "Save Dashboard" in the other dialog box.
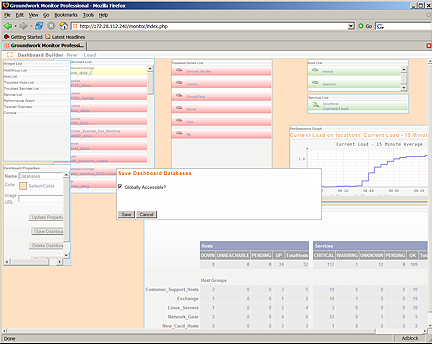
Unselect the "Globally Accessible?" box so you can choose the permissions
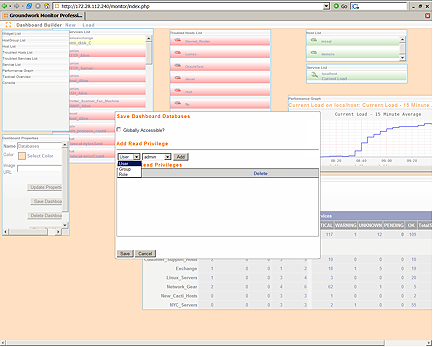
Here you can choose Users, Groups, or Roles that have permissions for accessing this dashboard.
Now when the designated viewers log into the portal, and have only the Dashboard Viewer application available to them, they will only be able to open the dashboards for which they have permissions. Restricting their view to only what they are responsible for will help them to stay focused, and prevent information overload.
* Nagios is a registered trademark of Nagios Enterprises

